Four VSC benchmark System
Use case purpose:
This 100% power electronics small test system conbines VSC and wind turbines technologies, grid following and grid forming controls. It aims at showing the limitations of the phasor approximation while being small and easily tractable but realistic. Hence, an EMT and RMS version of this system exist for the benchmark.
This case is typical of the converter driven stability slow interactions problem.
References:
This benchmark was originally proposed by Prof. Thierry Van Cutsem (Université de Liège, Belgium) in the view of showing the limitations of the phasor approximation, and use several network components developed by Prof. Xavier Guillaud (Ecole Centrale de Lille, France).
Network description:
The network is described by the following figure:
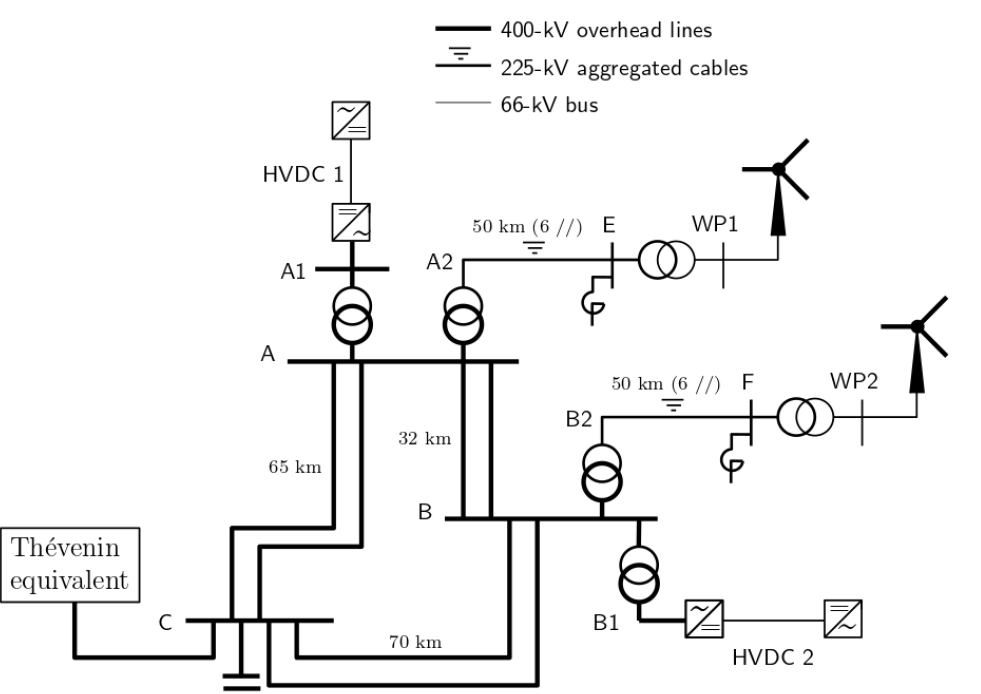
Dynamic models
This test case includes:
- two generic HVDC VSC lines
- two wind turbines generators (equivalent for a Wind park)
- two sets of 6 cables in parallel (225kV)
- seven 400kV overhead lines
- six two windings transformers
- two shunt reactors
- one RL load
Data
| Line/Cable | Nominal Voltage | R | X | \(\omega *\frac{C}{2}\) | length | Snom |
|---|---|---|---|---|---|---|
| (V) | (\(\Omega\)) | (\(\Omega\)) | (\(\mu S\)) | (km) | (MVA) | |
| A-C* | 400 | 1.04 | 20.80 | 98 | 65 | 3000 |
| A-B* | 400 | 0.51 | 10.24 | 48 | 32 | 3000 |
| B-C* | 400 | 1.12 | 22.40 | 105 | 70 | 3000 |
| A2-E** | 225 | 0.42 | 0.83 | 9000 | 50 | 2400 |
| B2-F** | 225 | 0.42 | 0.83 | 9000 | 50 | 2400 |
- data for a single circuit ** data for a 6 cables in parallel
| Transformer | Nominal Voltage (V) | R (%) | X (%) | ratio (%) | Snom (MVA) |
|---|---|---|---|---|---|
| A1-A | 320/400 | 0.5 | 15.0 | 102 | 1200 |
| B1-A | 320/400 | 0.5 | 15.0 | 104 | 1700 |
| A2-A | 225/400 | 0.5 | 15.0 | 102 | 2400 |
| B2-B | 225/400 | 0.5 | 15.0 | 105 | 2400 |
| WP1-E* | 66/225 | 0.5 | 12.0 | 105 | 2400 |
| WP2-F* | 66/225 | 0.5 | 12.0 | 104 | 2400 |
- 6 transformers in parallel 400MVA each
| Converter | Snom (MVA) | Pnom (MVA) |
|---|---|---|
| WP1 | 2400 | 2300 |
| WP2 | 2400 | 2300 |
| HVDC1 | 1200 | 1150 |
| HVDC2 | 1700 | 1630 |
Scenarios
Scenario No. 1: Full export to transmission grid and large disturbance
Operating point No. 1
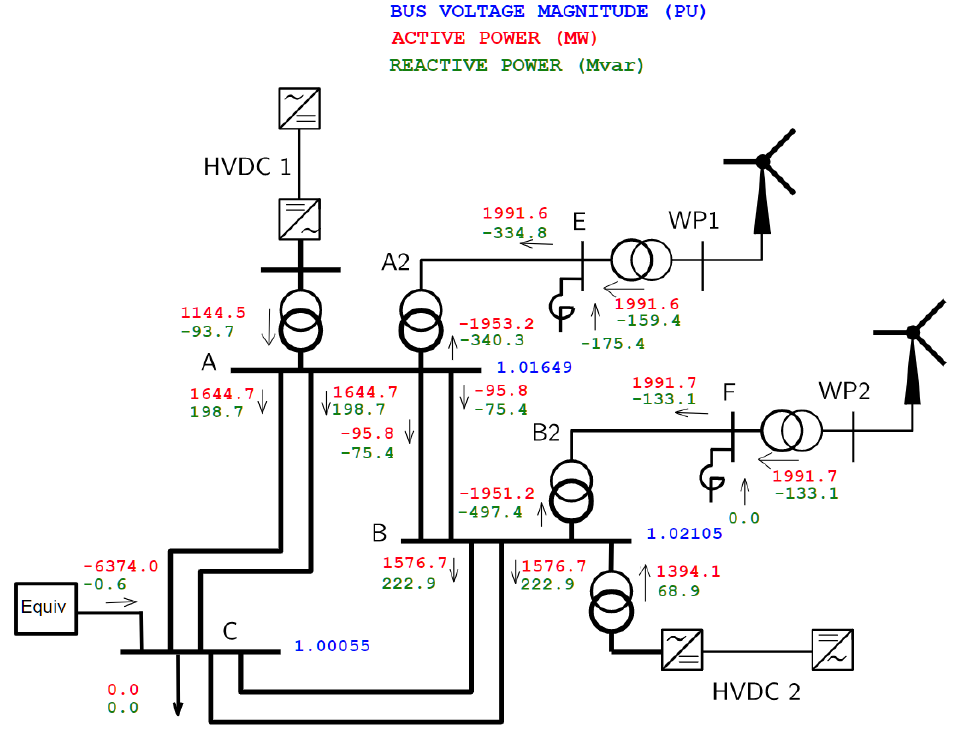
In this scenario, the power injected by the wind power plants WP1 and WP2 and by the HVDC links HVDC1 and HVDC2 is exported to the external system. The network is heavily loaded, and the active power of the load is equal to zero.
Control modes WP1, WP2 and HVDC1 are in grid following mode. WP1 in reactive power control, WP2 and HVDC1 are in voltage control mode, and the dynamic voltage support is disabled. HVDC2 is in grid forming mode.
Event : A solid three phase fault is applied on the first of the two lines A-C, next to bus A at 100ms. The fault is cleared after 150ms by opening the line.
Scenario No. 2: No export to transmission grid and mild disturbance
Operating point No. 2
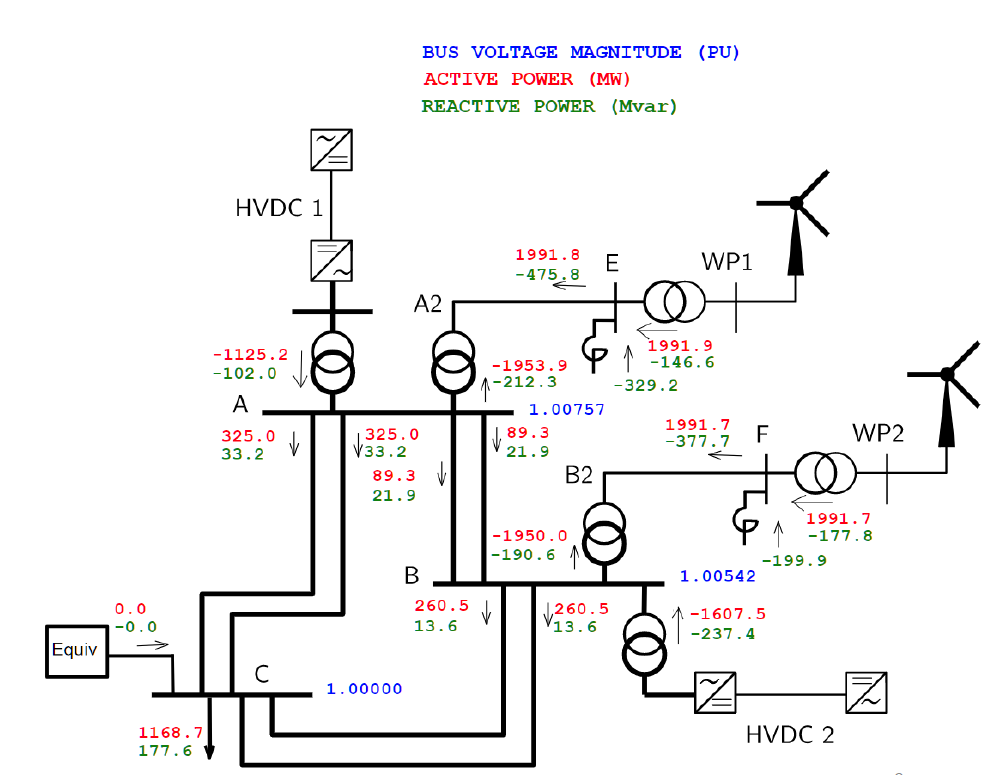
In this scenario, the power injected by the wind power plants WP1 and WP2 are exported by HVDC links, there is no export to the external network and the network is lightly loaded. The load at bus C is withdrawing active power, and the shunt reactors are withdrawing reactive power.
Variant A: A first variant of this case consists in unloading the C bus and export the full power to external equivalent.
Control modes WP1, WP2, HVDC1 and HVDC2 are all in grid following mode. WP1 in reactive power control, WP2 and HVDC1 are in voltage control mode, and the dynamic voltage support is disabled.
Variant B: A variant of this case is to switch the grid following control of the WP2 by a following forming control.
Event : A circuit breaker opens the line between A and B after 1 second. Several simulations with various values of the short-circuit power Ssc of the external equivalent grid [from 5500 MVA up to 20 000 MVA] are performed.
Simulation parameters
The system is an hybrid stiff DAE, the solver should be compatible with this type of problem. A fixed time step is applied for both phasor and EMT simualtions: 50 ms for EMT, The duration of simulation is of 1 second in the first scenario (event at 150ms), and of 3 seconds in the second scenario (event at 1 second).
Outputs:
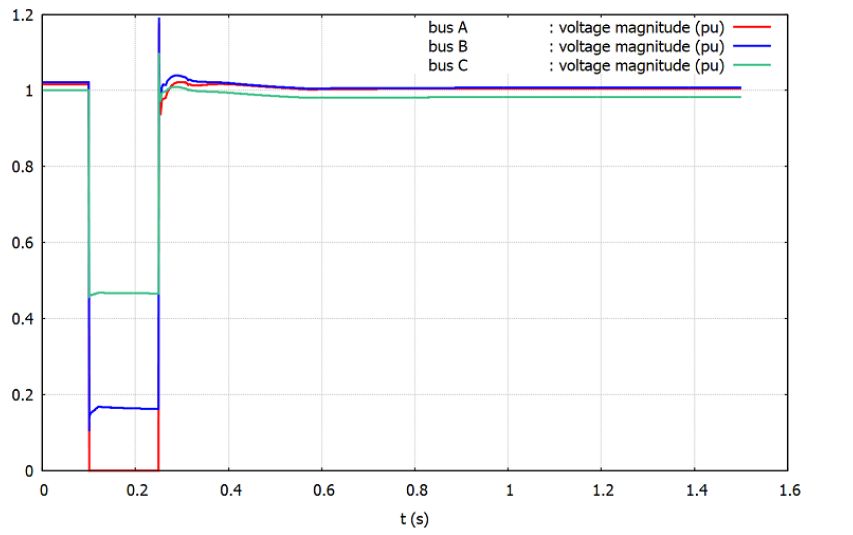
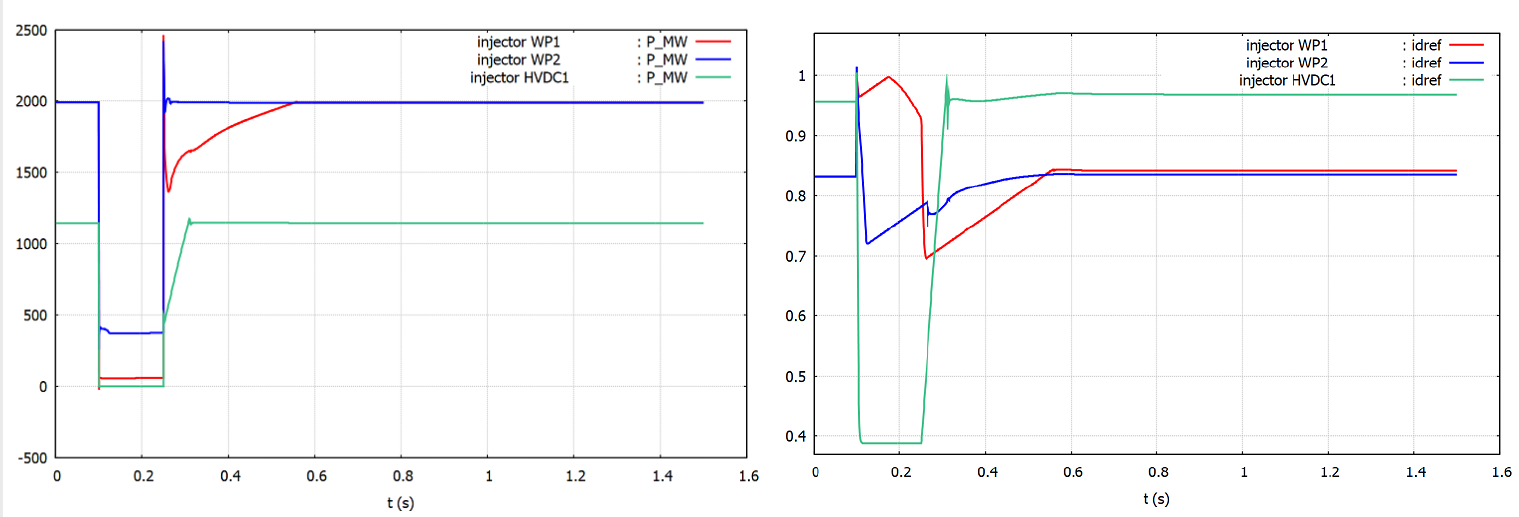
First scenario: Full export to transmission grid and large disturbance
The disturbance is seen at bus A, B and C with highest impact on bus A voltage as expected.
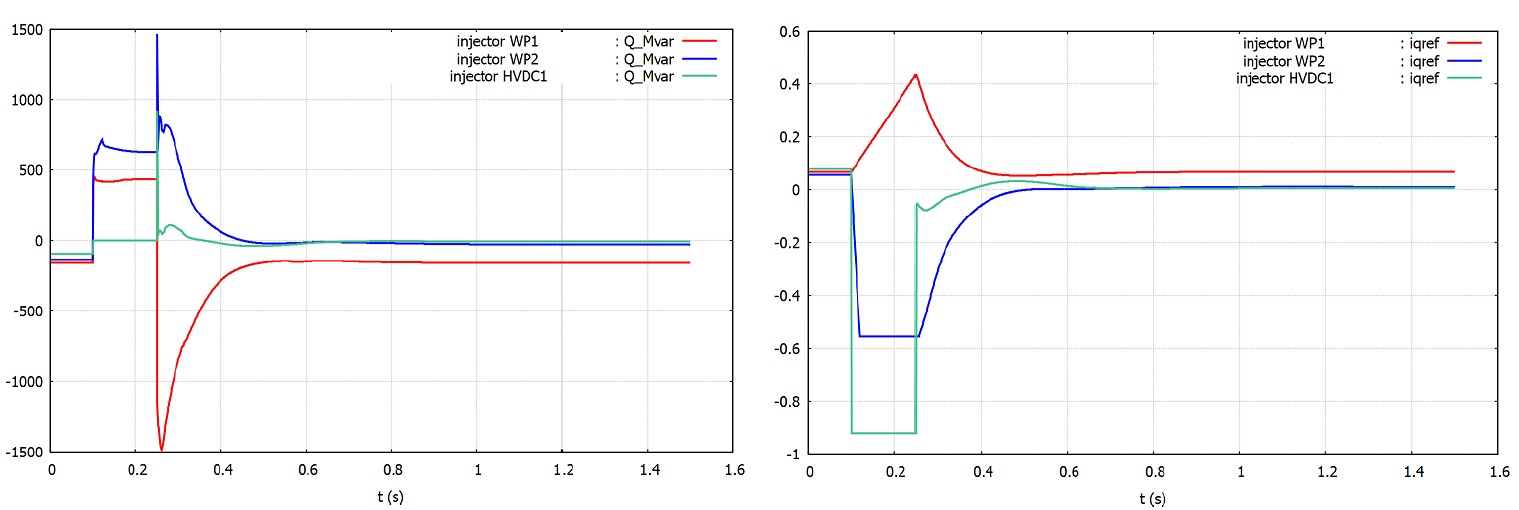
On the grid following converters’ responses, we can see the grid voltage support from WP2 and HVDC1 due to their voltage control support, whereas WP1 is in reactive power control.
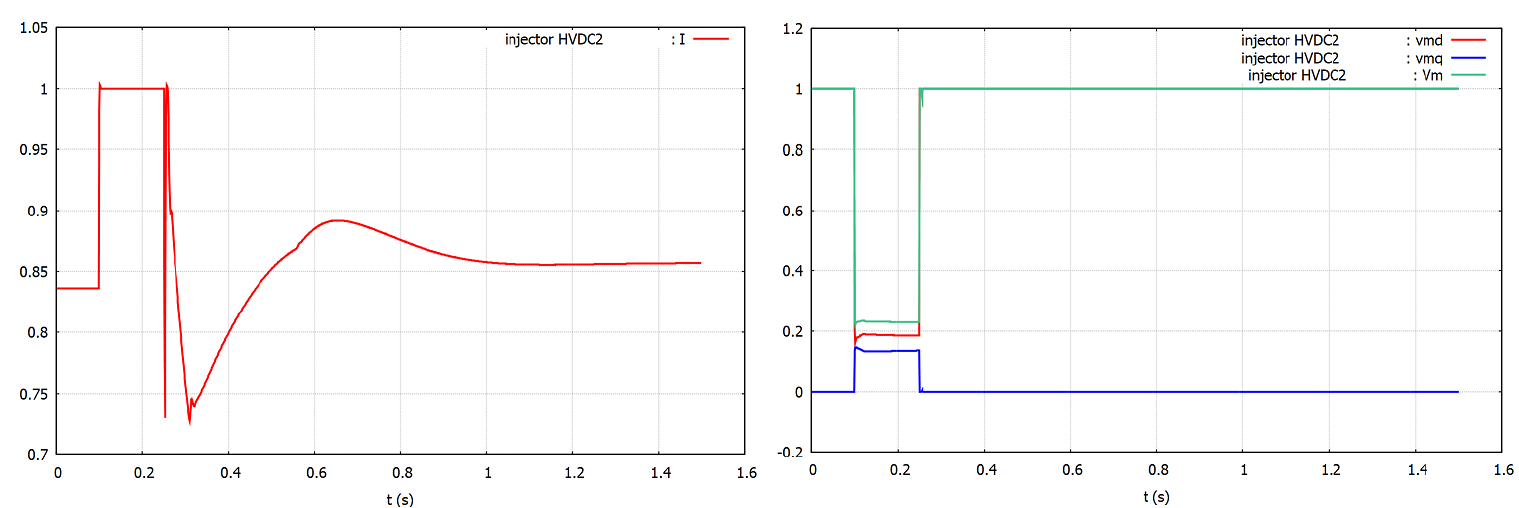
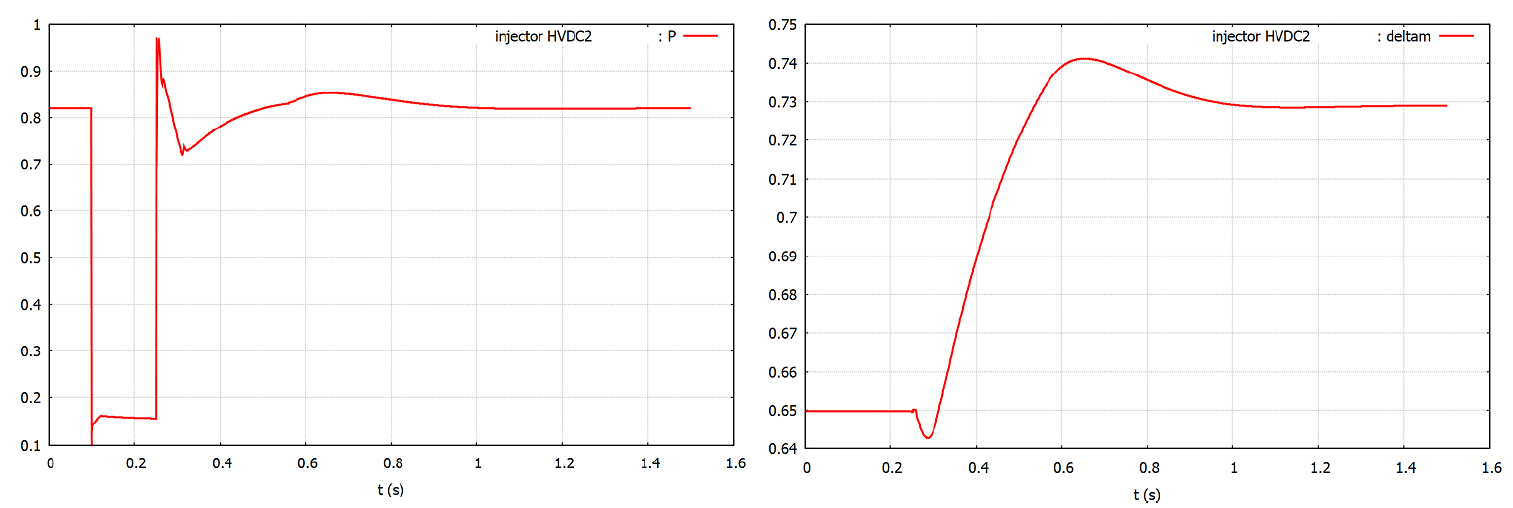
On the grid forming converter’s response (HVDC2), the injected current increases after fault up to its maximum value. When the fault is cleared (250ms), the injected current falls down quickly before slowly returning to a steady state value.
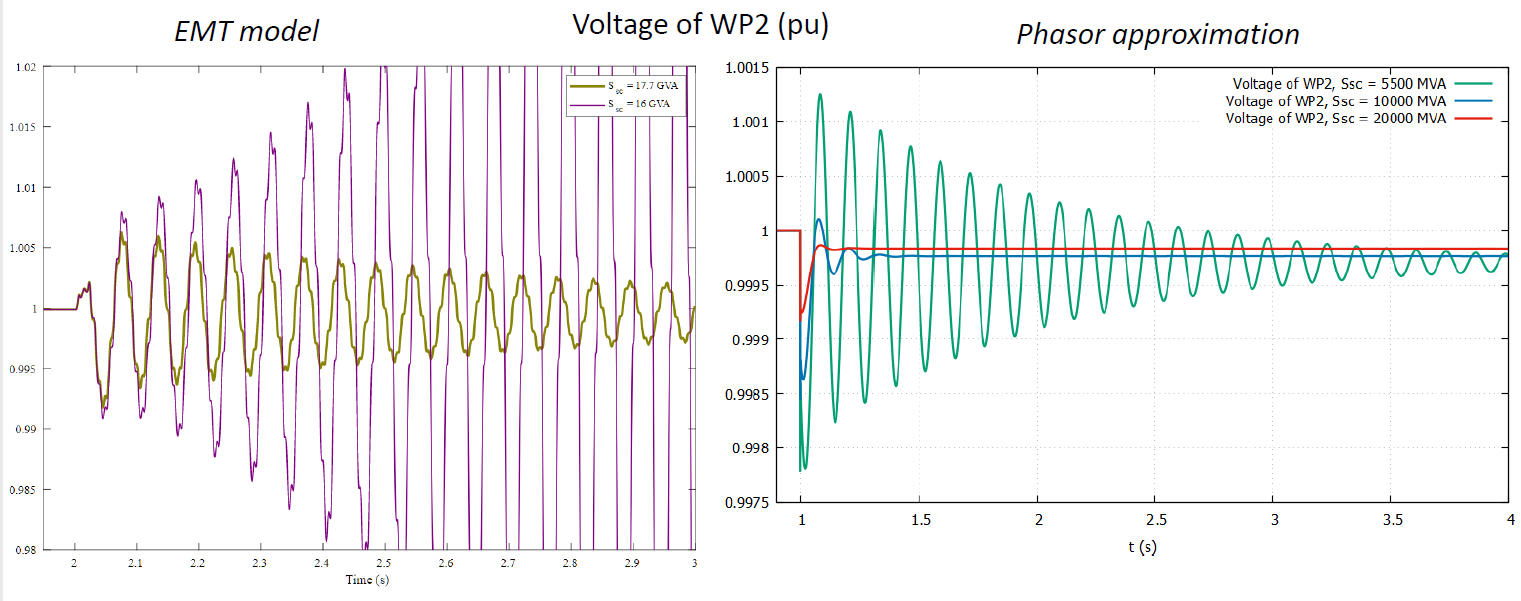
Scenario No. 2: No export to transmission grid and mild disturbance
In this second scenario, we can see that the response of the system to a mild disturbance very much depends on the short-circuit power of the connected equivalent grid. More importantly, this response is different if the system is simulated with a phasor simulator or an EMT one.
On the EMT simulation (left figure) we can see that the system becomes unstable if the short-circuit power is lower than 16 GVA. On the phasor simulation (right figure), the system is stable even if the short-circuit power is lower than 16 GVA (5.5 GVA). It seems that the phasor is underestimating the stability of the system in this very specific case.
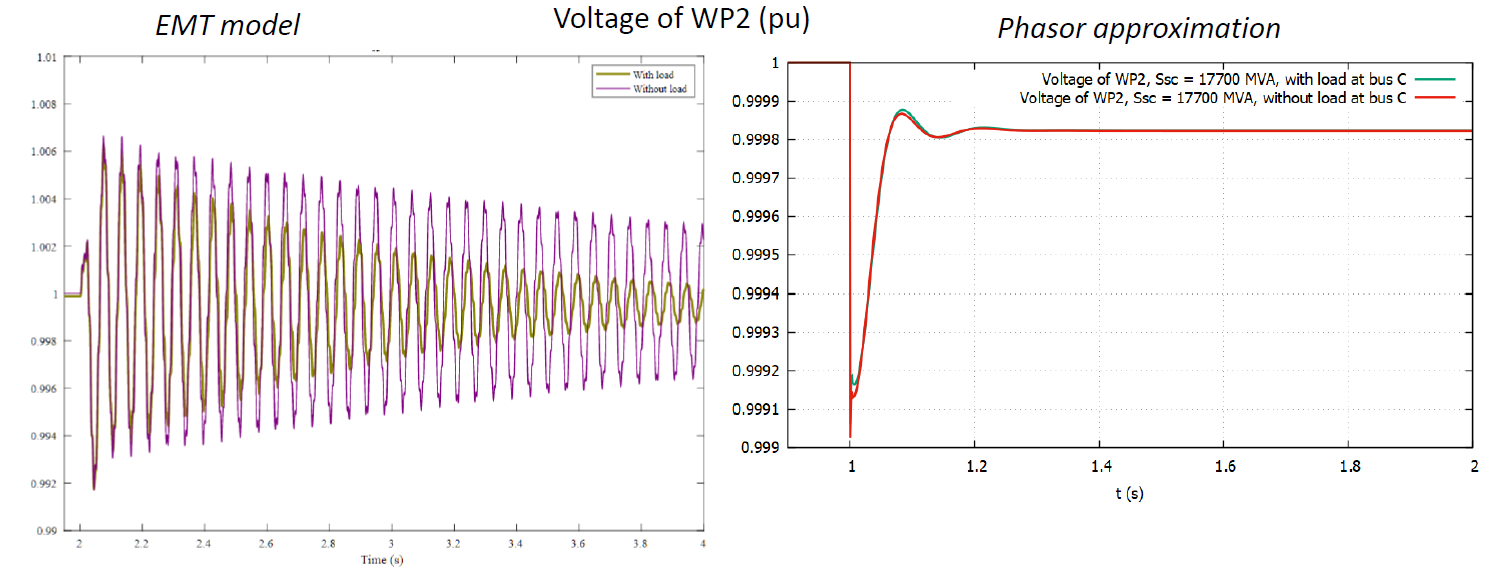
Variant A: When the C bus is unload and full power is taken by the external network, the difference between voltages curves is significant with the EMT simulation, with the phasor approximation, the difference is bearly noticable.
The damping effect of the constant admittance load isn’t properly captured.
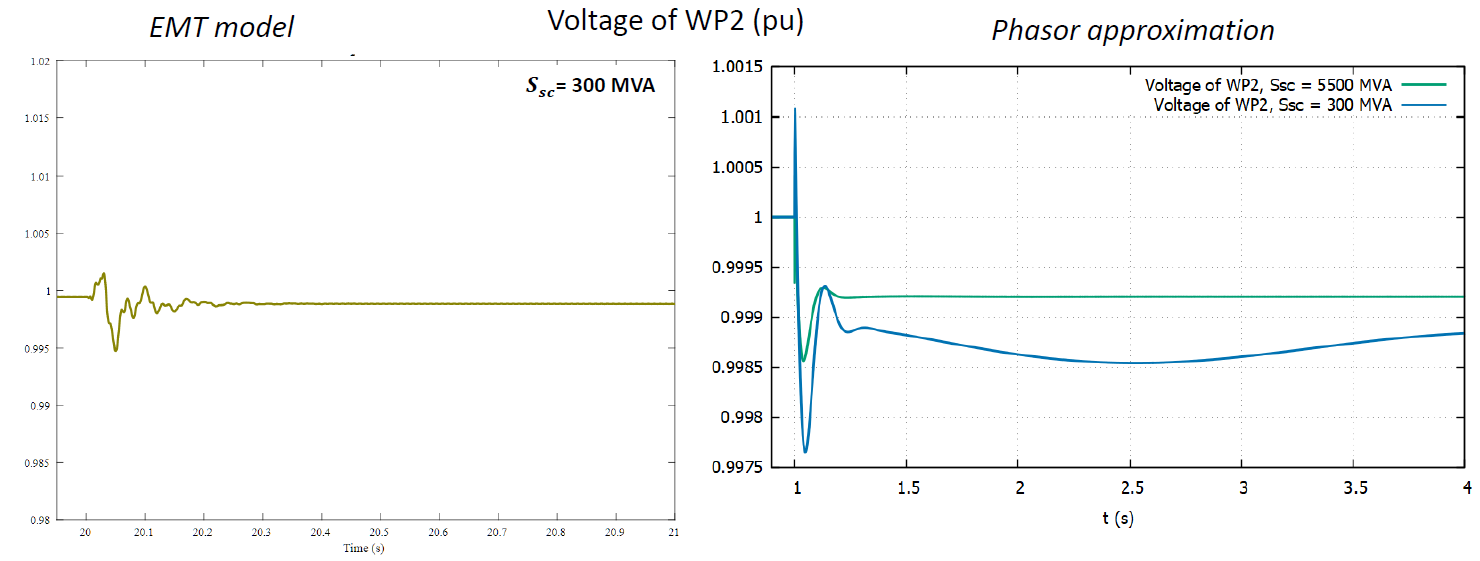
Variant B: When WP2 grid following control is changed by a grid forming one, the grid-forming control has such a strong stabilizing effect that both response remains stable even if the short-circuit power is as low as 300 MVA. Both simulation has comparable results.
Open source implementations
Some open source implementations of this use case are available in the following software solutions:
| Software | Phasor/EMT | URL |
|---|---|---|
| Dynawo | Phasor | Link |
| STEPSS | Phasor | … |
| EMTP-RV | EMT | … |
| PSCAD | EMT | … |
| SimPowerSystem | EMT | … |